Essential IT Support Performance Metrics Every Business Should Track
IT support performance metrics are essential tools that enable businesses to measure, analyze, and optimize their technology operations effectively. Whether you’re managing an internal team or considering IT support outsourcing, understanding these IT performance KPIs is crucial for maintaining operational excellence and driving strategic decision-making.
Modern organizations face mounting pressure to demonstrate the value of their IT investments. Consequently, implementing robust IT service metrics becomes not just beneficial but necessary for sustained success. These measurements provide invaluable insights into service quality, resource utilization, and overall business impact.
Why IT Support Performance Metrics Matter
The Business Impact of Measured IT Services
As a matter of fact, IT support metrics directly correlate with business productivity and profitability. Organizations that implement comprehensive IT management strategies experience up to 50% fewer downtime incidents compared to those using reactive approaches. Furthermore, measured IT environments demonstrate improved resource allocation and strategic planning capabilities.
Effective IT support performance metrics transform IT from a cost center into a value-driving business function. Additionally, comprehensive IT performance indicators enable organizations to identify bottlenecks, optimize workflows, and enhance user satisfaction across all technology touchpoints.
Strategic Benefits of Performance Measurement
Performance measurement provides the foundation for data-driven decision-making in IT operations. Moreover, it supports critical business decisions regarding technology investments, staffing requirements, and service delivery models. Organizations utilizing service desk metrics consistently outperform competitors in operational efficiency and customer satisfaction.
The strategic advantages extend beyond immediate operational improvements. Specifically, measurement frameworks enable businesses to benchmark against industry standards, justify technology spending, and demonstrate IT’s contribution to organizational success.
Core IT Support Performance Metrics Categories
Response and Resolution Metrics
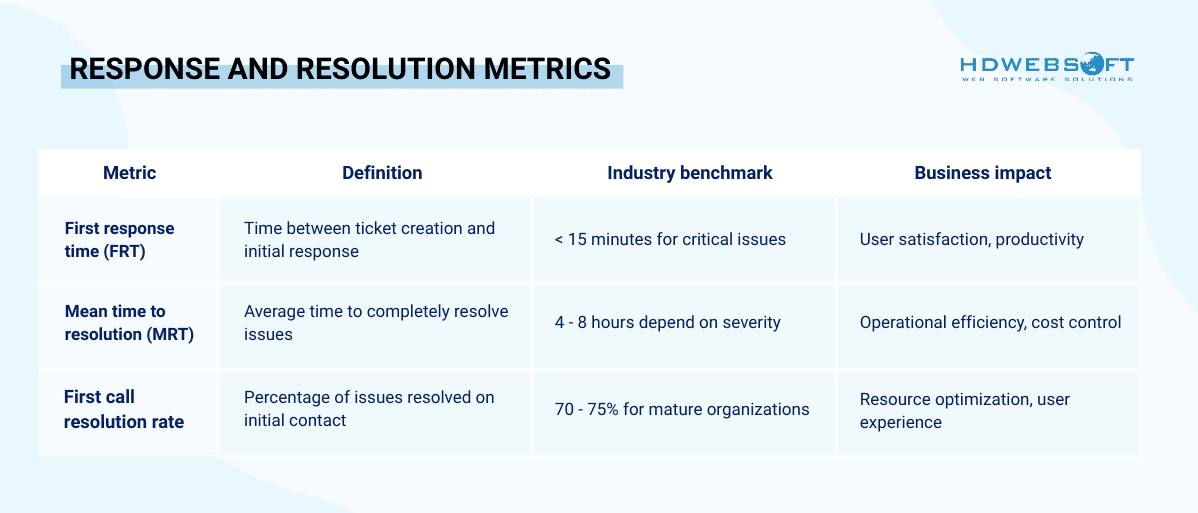
First of all, response and resolution metrics form the backbone of IT service measurement. These IT support performance metrics directly impact user productivity and satisfaction levels across the organization.
Availability and Reliability Metrics
Secondly, system availability metrics provide essential insights into infrastructure stability and service reliability. These help desk KPIs are particularly valuable for organizations operating mission-critical applications and services.
System Uptime and Downtime Analysis
The true reliability of IT infrastructure components is revealed by system uptime measurements. Industry-leading organizations typically maintain 99.9% uptime for critical systems, translating to less than 8.77 hours of annual downtime. However, achieving such levels requires proactive monitoring, preventive maintenance, and robust disaster recovery planning.
Planned versus unplanned downtime analysis offers additional strategic insights. While planned maintenance is necessary for system health, excessive unplanned outages indicate underlying infrastructure problems requiring immediate attention.
Mean Time Between Failures (MTBF)
MTBF calculations help predict equipment lifecycle patterns and optimize maintenance schedules. These IT support performance metrics enable proactive hardware replacement strategies, reducing unexpected failures and associated costs. Additionally, MTBF trends guide strategic decisions regarding infrastructure investments and technology refresh cycles.
Quality and Satisfaction Metrics
Lastly, user satisfaction metrics bridge the gap between technical performance and business value. These service desk metrics provide crucial feedback regarding service quality and user experience effectiveness.
Customer Satisfaction Score (CSAT) Implementation
CSAT surveys capture immediate user feedback following support interactions. Well-designed surveys typically achieve 25-30% response rates when properly implemented. Furthermore, CSAT scores correlate strongly with other IT performance indicators, providing validation for technical measurements.
Successful CSAT programs focus on actionable feedback rather than generic satisfaction ratings. Consequently, questions should address specific service aspects like response time, solution effectiveness, and communication quality.
Net Promoter Score (NPS) for Internal IT Services
NPS adaptation for internal IT services provides long-term satisfaction trends and loyalty measurements. Organizations achieving NPS scores above 50 for internal IT services typically experience lower employee turnover and higher productivity levels.
Regular NPS tracking reveals evolving user expectations and service gaps requiring attention. Moreover, NPS trends often predict upcoming support volume changes and resource requirements.
Efficiency and Productivity Metrics
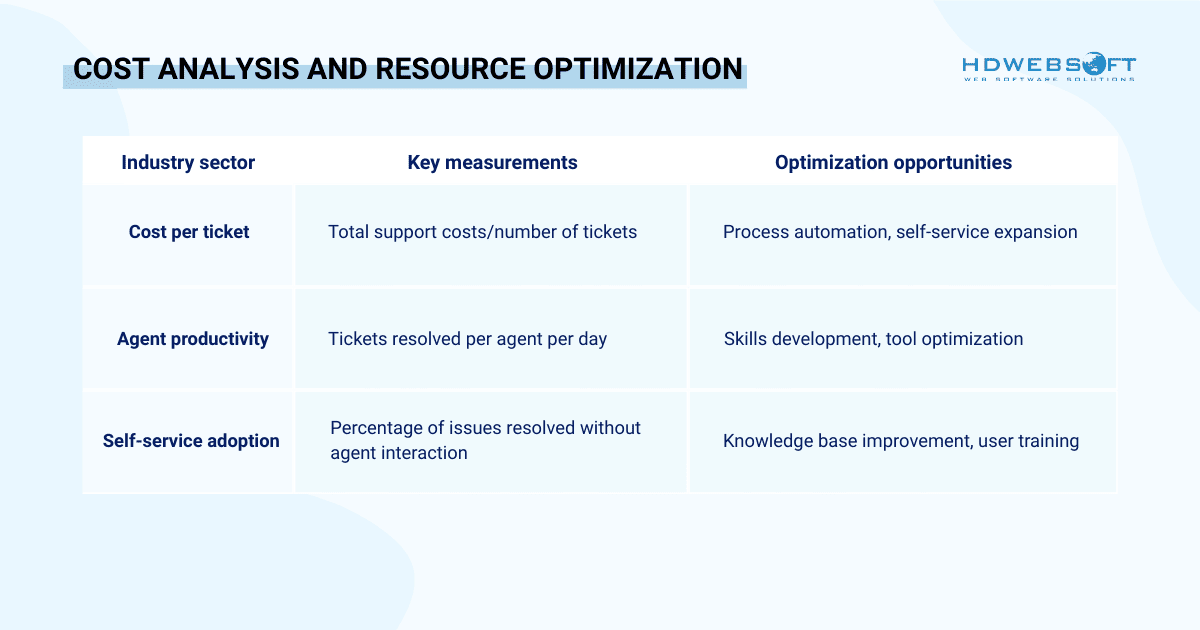
Cost Analysis and Resource Optimization
Cost-related IT support performance metrics enable organizations to optimize resource allocation and demonstrate the IT value proposition effectively. These measurements support strategic decisions regarding staffing, technology investments, and service delivery models.
Self-Service Success Measurements
In addition, self-service capabilities significantly impact overall support efficiency and user satisfaction. These IT performance indicators measure the effectiveness of knowledge management systems and user empowerment initiatives.
Notably, according to 75% of businesses, adopting self-service has led to several improvements. They are first-level resolution, first-contact resolution, as well as reductions in cost per contact and cost per incident. Furthermore, high self-service adoption reduces support ticket volume, enabling teams to focus on complex problem-solving activities.
Knowledge base analytics provide insights into content effectiveness and user behavior patterns. Consequently, regular content optimization based on search patterns and success rates improves self-service outcomes and reduces support demands.
Implementing IT Support Performance Metrics
Choosing the Right Metrics Framework
Successful implementation begins with selecting appropriate IT support performance metrics aligned with business objectives. Organizations should focus on 5-7 core metrics initially, expanding measurement scope as maturity increases.
Business Alignment Strategies
Metric selection must reflect organizational priorities and stakeholder expectations. Executive dashboards typically emphasize financial and strategic indicators, while operational teams focus on technical performance measures. Therefore, multi-layered reporting approaches satisfy diverse stakeholder requirements effectively.
Industry-specific considerations also influence metric selection. Healthcare organizations prioritize compliance and security metrics, while manufacturing companies emphasize uptime and operational continuity measurements.
Tools and Implementation Approaches
Modern ITSM platforms provide comprehensive measurement capabilities for service desk metrics collection and analysis. Popular solutions include ServiceNow, Jira Service Management, and Freshservice, each offering unique advantages for different organizational contexts.
Moreover, integration capabilities determine implementation success and ongoing value realization. As a result, organizations should evaluate API availability, reporting flexibility, and dashboard customization options when selecting measurement tools.
Dashboard Design Best Practices
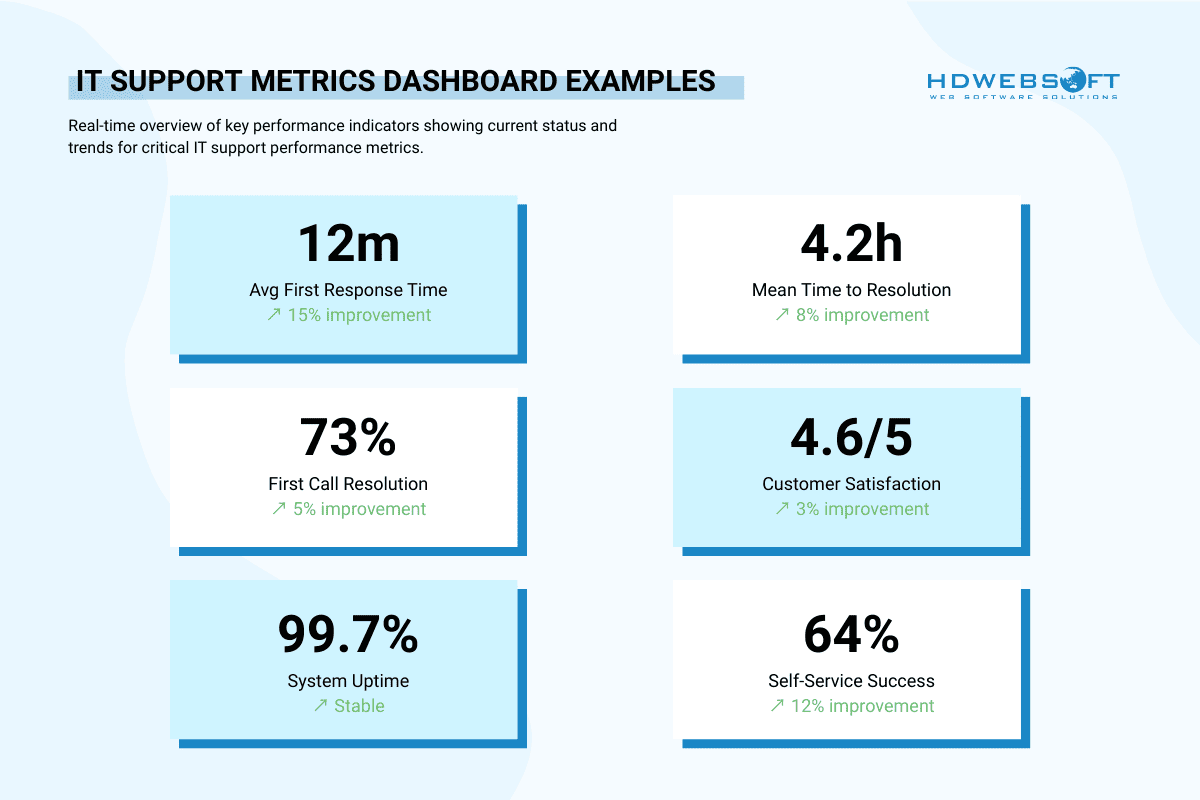
Effective IT support performance metrics dashboards balance comprehensive information with a user-friendly presentation. Real-time metrics serve operational teams, while historical trends support strategic planning activities. Additionally, mobile accessibility ensures stakeholder access regardless of location or device preferences.
Visual design principles also significantly impact dashboard adoption and effectiveness. Therefore, clear hierarchies, consistent color schemes, and intuitive navigation enhance user experience and decision-making capabilities.
Common Pitfalls and Best Practices
Avoiding Measurement Mistakes
Organizations often fall into common traps when implementing IT support performance metrics programs. Understanding these pitfalls enables proactive prevention and ensures measurement initiatives deliver genuine business value.
Metric Gaming and Performance Distortion
Perhaps the most significant risk is metric gaming, where teams focus on optimizing measurements rather than achieving genuine service improvements. For example, support agents might artificially inflate first-call resolution rates by marking complex tickets as “resolved”. Then, they will be reopened later under different categories. This behavior distorts data accuracy while degrading actual service quality.
Similarly, response time gaming occurs when agents send immediate acknowledgment messages without actually addressing user concerns. While this improves FRT metrics, it creates user frustration and potentially damages long-term satisfaction scores.
Preventing Target Fixation Through Balanced Measurement
Balanced scorecards combining quality and quantity IT performance indicators reduce gaming risks while maintaining improvement focus. Effective frameworks typically include:
- Quantitative measures: Response times, resolution rates, ticket volumes
- Qualitative indicators: User satisfaction scores, solution accuracy rates, communication effectiveness
- Leading indicators: Training completion rates, knowledge base contributions, proactive problem identification
- Lagging indicators: Overall system availability, cost trends, strategic objective achievement
Hence, regular review and adjustment of IT support performance metrics ensure continued relevance and effectiveness over time. Organizations should reassess their measurement frameworks quarterly, incorporating stakeholder feedback and evolving business requirements.
Over-Measurement and Analysis Paralysis
Another common pitfall involves measuring too many indicators simultaneously, leading to information overload and decision paralysis. A recent research note that selecting too many KPIs can blur strategic focus. It’s hard to decide which metrics matter, and overloading organizations with measures dilutes clarity and actionability.
Typically, successful programs focus on 5-7 primary metrics initially, expanding gradually as measurement maturity increases. This approach ensures adequate attention to each indicator while building organizational confidence and capability.
Context-Aware Reporting and Communication
By being context-aware, reporting helps prevent misinterpretation and supports informed decision-making. Raw numbers without context often mislead stakeholders and result in inappropriate conclusions. For instance, an increase in ticket volume might indicate declining service quality or could reflect successful user adoption of new technologies requiring additional support.
Furthermore, narrative explanations accompanying numerical data from IT support performance metrics enhance stakeholder understanding and engagement levels. Thus, effective reports should include trend analysis, comparative benchmarks, and actionable recommendations based on metric insights.
Continuous Improvement Strategies
Establishing Feedback Loops and Learning Cycles
In fact, successful measurement programs evolve continuously based on organizational learning and changing business requirements. Structured feedback loops ensure that IT performance indicators remain aligned with business objectives and stakeholder expectations.
Monthly stakeholder review sessions should evaluate metric relevance, identify emerging requirements, and adjust measurement approaches accordingly. These sessions typically include representatives from IT leadership, business units, and end-user communities to ensure comprehensive perspective integration.
Additionally, quarterly deep-dive analyses examine metric correlations, identify improvement opportunities, and validate measurement accuracy. These reviews often reveal unexpected relationships between different help desk KPIs and uncover optimization opportunities.
Benchmarking and Competitive Analysis
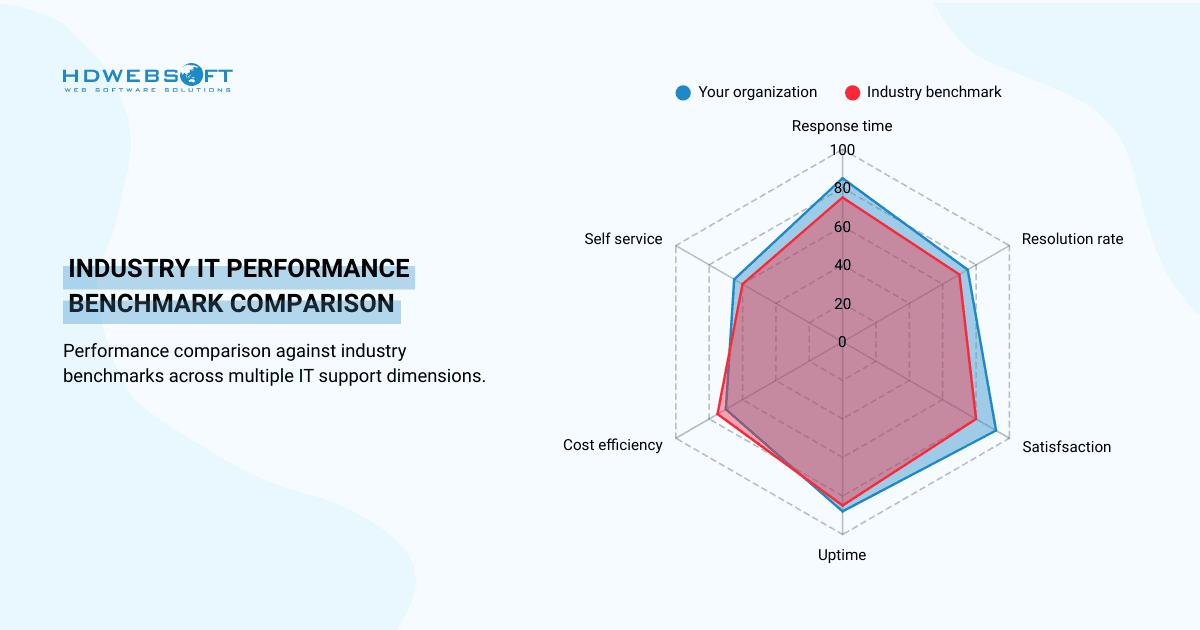
External benchmarking provides crucial context for internal performance evaluation and improvement target setting. Industry-specific benchmarking sources for IT support performance metrics include:
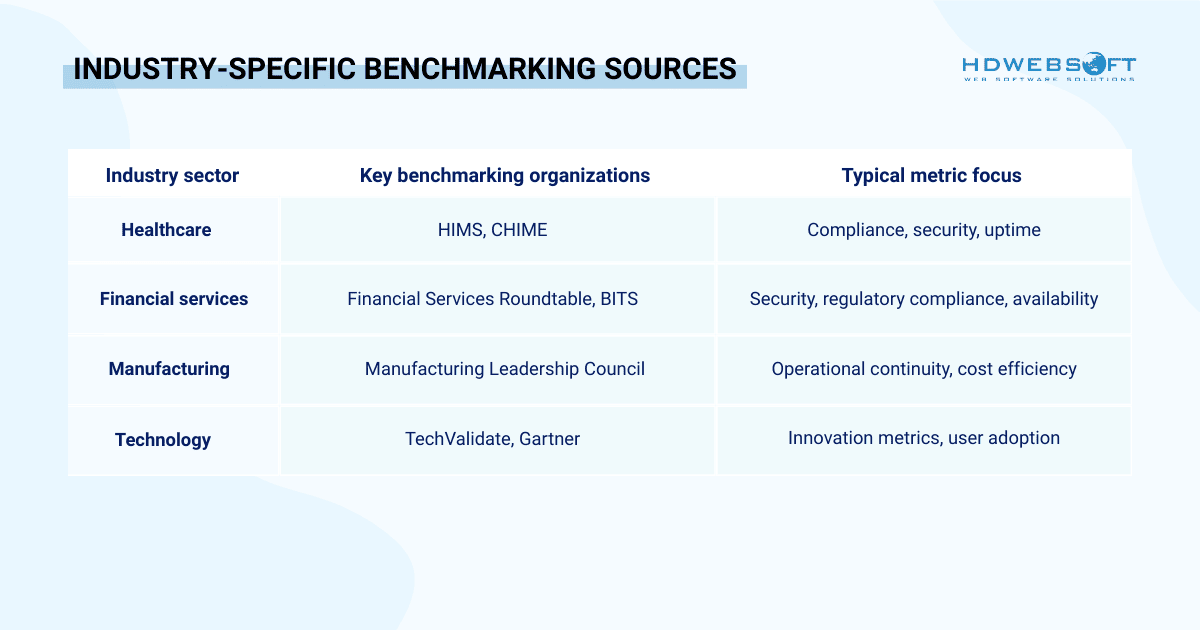
Peer comparisons reveal best practices and innovative approaches applicable to specific organizational contexts. However, benchmarking must account for organizational size, complexity, and industry-specific requirements to ensure meaningful comparisons.
Maturity Model Development
Service desk metrics maturity models provide structured improvement pathways and enable organizations to assess their current capabilities against industry standards. Typical maturity levels include:
- Level 1 – Reactive: Basic ticket tracking with minimal analytics.
- Level 2 – Proactive: Comprehensive metric collection with regular reporting.
- Level 3 – Predictive: Advanced analytics enabling trend prediction and proactive intervention.
- Level 4 – Optimized: Continuous improvement culture with automated optimization capabilities.
Therefore, organizations should assess their current maturity level and develop targeted improvement plans addressing specific capability gaps. This approach ensures systematic progression and sustainable improvement over time.
ROI of IT Support Performance Metrics
Investment Analysis and Cost Justification
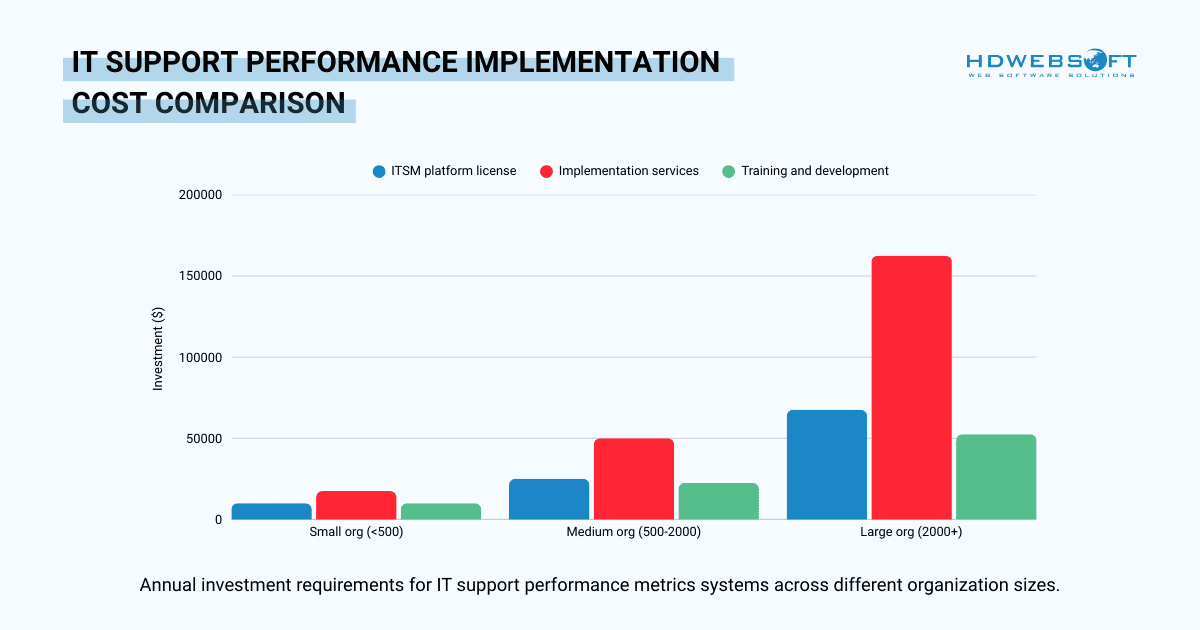
Implementing comprehensive IT support performance metrics systems requires substantial initial investment across multiple organizational areas. Understanding these costs enables accurate ROI calculations and supports executive buy-in for measurement initiatives.
Direct Implementation Costs
Initial tooling investments typically range from $5,000-$50,000 annually, depending on organizational size and feature requirements. Enterprise-grade ITSM platforms with comprehensive analytics capabilities command premium pricing but offer extensive customization and integration options.
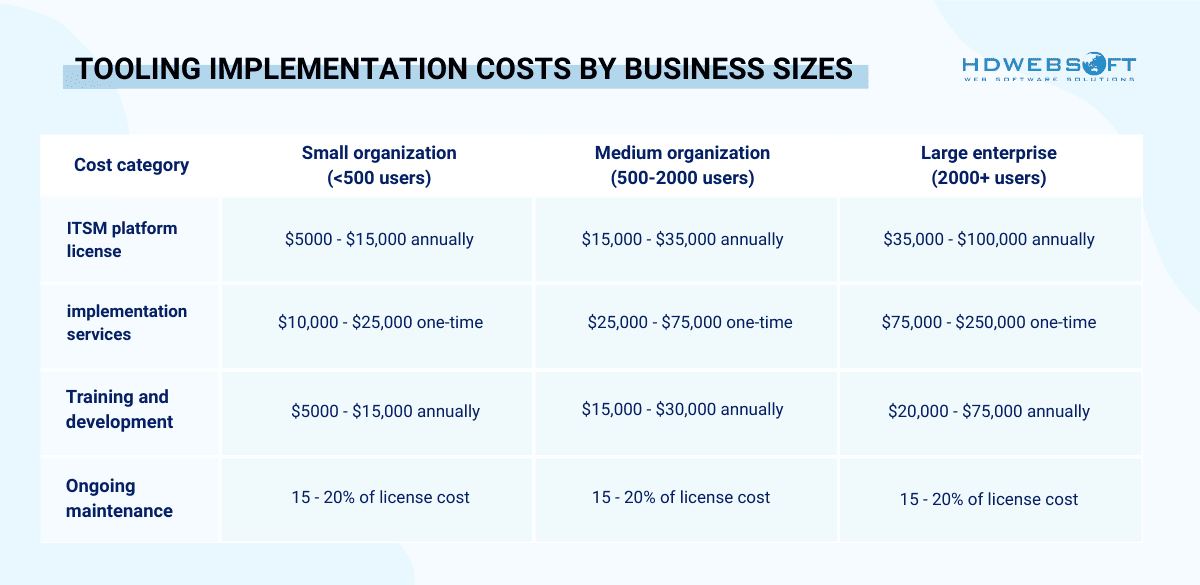
On the other hand, training investments encompass both technical skills development and change management activities. On average, training for US employees takes 57 hours, which organizations view as a healthy investment in skill development. However, formal training (structured learning hours) often falls much lower, at 13.7 hours per year.
Hidden Costs and Resource Requirements
Data migration and system integration often represent significant hidden costs in measurement implementations. Legacy system integration can require substantial development effort, particularly in complex environments with multiple disparate tools. Hence, using scalable solutions will help reduce long-term complexity by adapting to future system changes and growth.
Change management initiatives consume substantial organizational resources but prove critical for IT support performance metrics measurement success. Resistance to new reporting requirements and measurement-driven accountability often emerges without proper communication and stakeholder engagement strategies.
Quantifiable Returns and Value Realization
Operational Efficiency Improvements
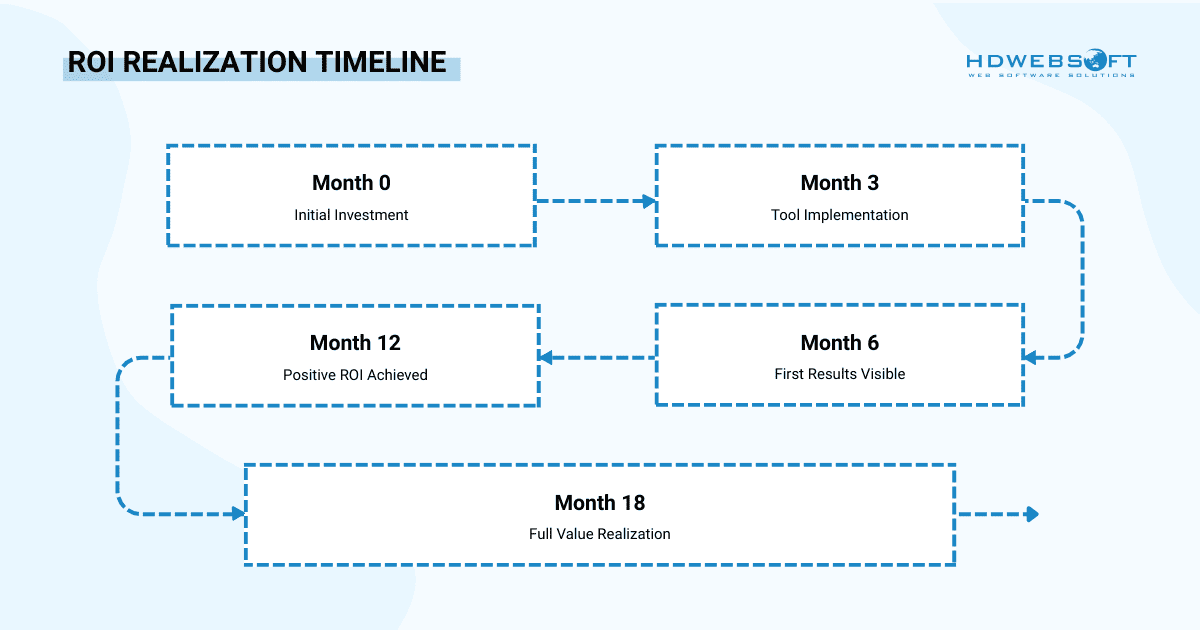
Organizations implementing comprehensive IT performance indicators typically realize measurable efficiency gains within the first year. These improvements manifest across multiple operational areas and provide cumulative value over time.
Resource optimization through data-driven staffing decisions often yields significant efficiency improvements. Accurate workload prediction enables optimal agent scheduling, reducing overtime costs while maintaining service level objectives. In addition, skill-based routing optimization improves first-call resolution rates substantially.
Moreover, process automation opportunities identified through metric analysis frequently reduce manual effort for routine activities. Particularly, automated ticket categorization, priority assignment, and initial response generation significantly reduce agent workload while improving consistency.
Cost Avoidance and Risk Mitigation
Proactive problem identification through trend analysis prevents major incidents that could result in significant business disruption. Organizations with mature measurement programs report a substantial reduction in critical incidents compared to reactive approaches.
The financial impact of avoided downtime often exceeds the entire IT support performance metrics program investment. Namely, preventing a single multi-hour outage affecting numerous users can save significant productivity costs, depending on industry and user roles.
Revenue Impact and Business Value
Improved IT service quality directly influences employee productivity and business outcomes. Organizations with superior internal IT services typically experience higher employee satisfaction and lower turnover rates.
Notably, enhanced decision-making capabilities enabled by comprehensive IT performance indicators support strategic technology investments and vendor negotiations. Data-driven contract discussions typically result in better terms compared to negotiations based solely on intuition or limited data.
Long-term Strategic Value Creation
Competitive Advantage and Market Position
Measurement capabilities create sustainable competitive advantages through a continuous improvement culture and operational excellence. That’s why organizations with mature IT performance indicators consistently outperform competitors in technology adoption, innovation speed, and market responsiveness.
The ability to demonstrate technical value through concrete IT support performance metrics enhances organizational credibility with customers, partners, and investors. This credibility proves particularly valuable during mergers, acquisitions, or significant business partnerships requiring technology due diligence.
Organizational Learning and Knowledge Capital
Comprehensive measurement programs generate valuable organizational knowledge that compounds over time. Historical performance data enables accurate capacity planning, technology lifecycle management, and strategic roadmap development.
Knowledge accumulation through systematic measurement creates institutional memory that persists beyond individual employee tenure. This organizational learning capability reduces risks associated with staff turnover and supports consistent service delivery during periods of change.
Innovation and Technology Leadership
Data-rich environments foster innovation by providing clear visibility into user needs, technology performance, and improvement opportunities. Hence, organizations with robust IT performance indicators often identify emerging technology requirements 6-12 months earlier than competitors.
Furthermore, comprehensive measurement frameworks support pilot program evaluation and technology adoption decisions. Clear success criteria and baseline measurements enable objective assessment of new technologies and approaches before full-scale implementation.
Vendor Relationship Optimization
Long-term IT support performance metrics’ data provides powerful leverage in vendor negotiations and relationship management. Historical performance baselines enable accurate service level agreement definition and penalty clause development.
Additionally, comprehensive benchmarking capabilities support multi-vendor evaluations and competitive procurement processes. Organizations with detailed performance requirements and measurement frameworks consistently achieve better contract terms and service delivery outcomes.
To Sum It Up
IT support performance metrics provide the foundation for operational excellence and strategic decision-making in modern organizations. Successful implementation requires careful metric selection, appropriate tooling, and commitment to continuous improvement principles. All the while, it’s important to balance measurement rigor with practical application to drive genuine service enhancement.
For businesses seeking to optimize their IT operations through expert partnership, HDWEBSOFT offers comprehensive software outsourcing services designed to enhance technological capabilities while maintaining cost efficiency. Our experienced team specializes in delivering scalable IT solutions that support measurable performance improvements and strategic business objectives.


