Building a Data-Driven Culture with Self-Service BI
Self-service BI is transforming how businesses use data. It empowers everyone, not just experts, to find answers. This approach puts powerful analytical tools directly into the hands of business users and moves away from traditional models. In the past, business intelligence (BI) was often slow. Business users had to rely heavily on the IT department or dedicated analysts. They would request reports and wait. This created bottlenecks and slowed down decision-making.
This blog post will explore what self-service business intelligence truly means. Furthermore, we will discuss its essential building blocks, popular tools, and emerging trends in this field.
What is Self-Service BI?
At its core, self-service BI refers to business intelligence tools and platforms designed for non-technical users. It allows them to access, analyze, and visualize data independently. As a result, they can create their own reports and dashboards without needing specialized technical knowledge or skills. Ultimately, the goal is to democratize data access, making analysis available to a wider audience within an organization. Think of it as putting a powerful data laboratory on every business user’s desk.
Traditional BI was centralized. IT teams managed data warehouses and built reports based on user requests. While this approach worked, it wasn’t agile. Business questions change rapidly, and waiting for IT to deliver insights has become a significant drawback. Self-service business intelligence solves this problem by providing intuitive interfaces. With these tools, users can drag and drop data fields, easily build visualizations, and explore data on their own terms.
Market Size
The market for autonomous business intelligence is experiencing significant growth. According to Fortune Business Insights, the global self-service BI market is projected to reach $7.99 billion in 2025. What’s more, the number is forecasted to grow significantly in the coming years. This growth highlights the increasing adoption of these tools.
Owing to this, businesses start to recognize the value of data-driven decision-making and want to enable more employees to contribute. The market expansion reflects this growing demand and a clear shift in how organizations approach data analysis. Consequently, more companies are investing in platforms that empower their workforce to improve efficiency and agility.
Key Drivers of Growth

The rise of self-service business intelligence is driven by multiple factors.
First, the shift toward a data-driven culture plays a major role. An autonomous BI culture encourages curiosity, promotes data exploration among all employees, and moves data analysis from a specialized function to a company-wide capability. Hence, this allows for faster reactions to market changes, better understanding of user acceptance and behavior, and informed business decisions.
Second, reducing the IT burden has a big impact. Self-service BI frees up IT teams by letting business users handle their own reporting needs. Similarly, the adoption of help desk software streamlines support requests, allowing IT to focus more on strategic projects. As a result, overall resource allocation and efficiency improve.
Third, cloud computing has fueled the technology’s growth. Cloud-based platforms offer scalability, easy deployment, remote accessibility, and built-in features like data connectors and preparation tools. Organizations can avoid heavy investments in on-premises infrastructure while giving users flexible, powerful analytics tools.
The Foundation of Self-Service Business Intelligence
For BI to be successful, several foundational elements must be in place. Without a solid foundation, it can lead to confusion and even incorrect insights. Therefore, understanding these components is crucial as they provide the necessary support structure and enable users to explore data confidently.

Data integration from multiple sources
Modern businesses generate data everywhere. Data comes from various sources: CRM systems, ERP systems, marketing platforms, databases, and spreadsheets. Therefore, a robust self-service BI environment needs to connect to all these sources and pull data together. This creates a unified view of the business.
Moreover, users shouldn’t need to be database experts. The platform should handle the complexity of connecting different systems. It should bring disparate data into one accessible place. This unified view is essential since it allows users to see the whole picture. They can analyze relationships between different data sets.
Resultantly, it leads to richer, more insightful analysis. It breaks down data silos, which can hinder a comprehensive understanding of business performance. Thus, easy access to integrated data is the first step for users to start their analysis journey.
Self-service data preparation
Raw data is often messy, can contain errors, and might be inconsistently formatted. Before analysis, the data needs cleaning and transforming. In traditional BI, IT support handled this. Now, autonomous BI tools empower users to do it themselves. They offer visual tools for data preparation. Users can use self-service BI to clean data. They can reshape it and combine data sets, and it can be achieved with minimal technical coding. This is often called “ETL” or “ELT,” simplified for business users.
Tools might offer visual workflows that guide users through the process. As a result, this ensures data quality at the user level and saves time waiting for IT. In many cases, users most familiar with the data can prepare it, which often leads to better data quality. Because of this familiarity, they understand the nuances of their specific data. Consequently, this direct involvement improves accuracy and increases user confidence in their results.
Business User-Centric Interfaces
The interface suiting every business user is also paramount, and decentralized business intelligence tools are designed for usability.
First of all, they feature intuitive drag-and-drop interfaces. Users can build reports and dashboards visually. They don’t need to write complex queries. Interactive dashboards allow users to explore data dynamically. Furthermore, self-service BI can filter data and drill down into details. They can change visualization types easily. Since the interface should be approachable for everyone, extensive training shouldn’t be required. After all, the ultimate goal is to make data exploration as simple as using a spreadsheet.
This widespread usability is key, given that it ensures high adoption rates across the organization. When tools are easy to use, people are more likely to use them, increasing the ROI in the technology.

Solid Data Governance
While autonomous BI empowers users, it must be controlled. Data governance ensures data accuracy, maintains data security, and ensures compliance with regulations. A strong governance framework defines data ownership, sets access permissions, and establishes data quality standards. Hence, self-service business intelligence platforms should integrate governance features. They should allow administrators to control access, track data usage, and provide audit trails. This prevents unauthorized access to sensitive data and makes sure that users are working with trusted information.
Governance in a self-service BI world is a balance, giving users freedom with necessary controls. It prevents the creation of conflicting versions of the truth and ensures that insights are reliable. Plus, proper governance builds trust in the data, which is essential for making confident decisions. It protects the organization from data-related risks and ensures responsible data usage.
Popular Autonomous BI Tools
Many tools are available today that facilitate self-service business intelligence. They vary in features and complexity, but they share the common goal of making data analysis accessible to business users. Here are three prominent examples that are widely used and demonstrate the capabilities of modern autonomous BI platforms.
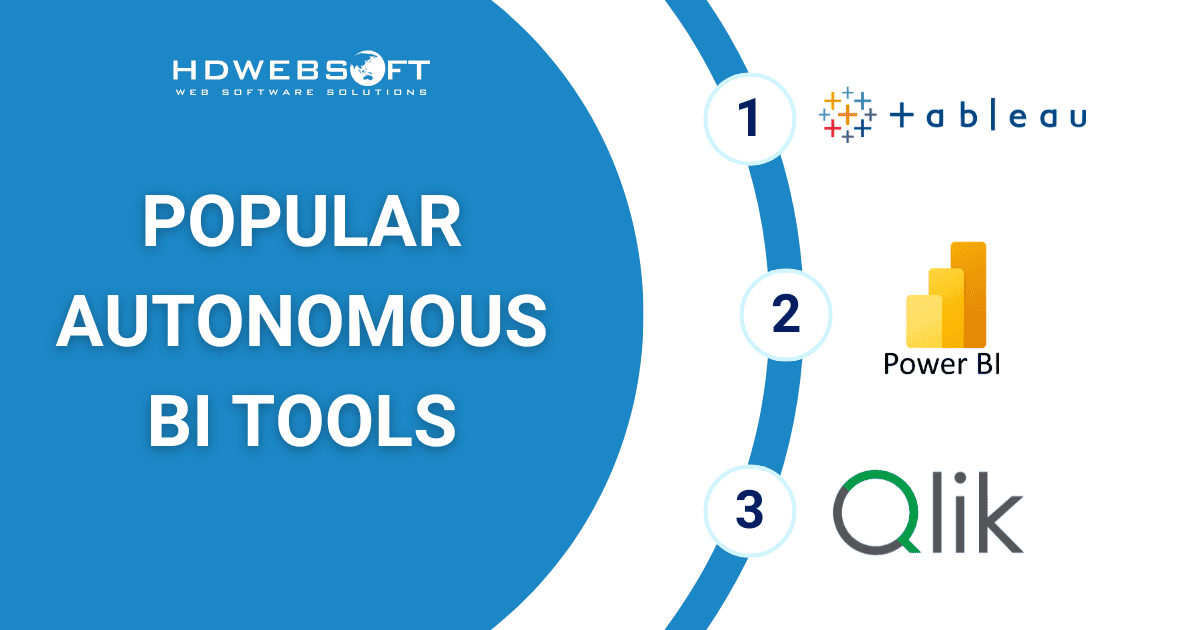
Tableau
One popular example is Tableau, a tool renowned for its powerful data visualization capabilities. The self-service BI platform offers a highly intuitive drag-and-drop interface. Thus, it’s easy for users to create visualizations and explore data without technical expertise.
Primary capabilities
- Powerful data visualization: Tableau is widely known for its ability to create stunning and interactive visualizations that simplify complex data.
- Drag-and-drop interface: The user-friendly interface allows users to easily connect to various data sources and create dynamic dashboards and reports.
- Tableau Public: Users can share their visualizations online. Consequently, this fosters a community of data explorers who can learn from each other’s insights.
- Visual analytics focus: Tableau’s emphasis on visual analytics helps users quickly identify patterns and trends in their data.
- Engaging data exploration: The visual approach to data analysis encourages users to uncover insights they might not discover in traditional reports.
Microsoft Power BI
Another widely used tool is Microsoft Power BI, a versatile platform that integrates seamlessly with other Microsoft products. Naturally, the self-service BI tool becomes a natural choice for many organizations. Its rich set of features supports data modeling, visualization, and reporting.
Notable characteristics
- User-friendly interface: Designed for ease of use, Power BI simplifies data modeling and visualization tasks. Owing to this, it’s accessible to both technical and non-technical users.
- Wide data source support: Users can connect to hundreds of data sources and easily import data for analysis.
- Interactive dashboards and reports: Users can create dynamic, interactive dashboards and share reports easily within their organization.
- Power BI Service: It’s a free application that allows users to connect and visualize data on their local machine. Moreover, it enables sharing and collaboration, making it easy to distribute reports and engage with stakeholders.
- Excel integration: Power BI’s tight integration with Excel lowers the learning curve for users familiar with Excel.
- Data preparation capabilities: Power Query Editor enables users to transform data, providing powerful self-service features for data preparation.
Qlik Sense
A third example is Qlik Sense, a powerful self-service BI platform designed to support flexible, intuitive data exploration. It stands out for its unique approach to self-service analytics. Accordingly, users are able to uncover insights without being restricted by traditional data hierarchies.
Key features
- Associative data model: Users can explore data freely by clicking on data points. Then, the tool automatically highlights related information to reveal deep insights.
- Responsive UI: Qlik Sense adapts to different devices, making it easy to access and work with data on the go.
- Emphasis on data discovery: The associative engine allows flexible exploration without being restricted by predefined hierarchies.
- Support for guided analytics: This feature assists new users, making the transition to autonomous BI smoother and more intuitive.
Self-Service Business Intelligence Trends
The business world is constantly evolving with new technologies and approaches emerging regularly. Several key trends are shaping its future, making the technology even more powerful and accessible. These trends are pushing the boundaries of what business users can achieve with self-service BI.
Integration of AI and Machine Learning
One major trend is the integration of Artificial Intelligence and Machine Learning. AI and ML are making autonomous BI tools smarter, providing automated insights, identifying trends, and suggesting relevant questions. This trend is often called augmented analytics.
Also, AI automates data preparation, recommends visualizations, and explains insights in natural language, making complex analysis easier for business users. It significantly enhances the value of the BI solutions, transforming data into actionable intelligence.
The Rise of Cloud-Based Self-Service BI
Another significant trend is the move towards cloud-based BI. Cloud platforms offer scalability, flexibility, and easier access from anywhere. They simplify deployment, have lower upfront costs, and use a subscription model, making them more accessible to small and medium-sized businesses.
In addition, cloud BI fosters collaboration, as users can easily share dashboards and reports. It provides the necessary infrastructure for large-scale data processing, ensuring performance and reliability. As a result, it is becoming the standard deployment model for self-service BI.
Growing Importance of Mobile BI

Mobile BI is gaining importance as business users increasingly require access to data on the go. These apps allow users to view dashboards and interact with reports on smartphones and tablets. Due to this, users have access to critical insights anytime and anywhere.
In fact, mobile BI is designed for smaller screens and touch interfaces, offering a streamlined user experience. This is crucial for busy professionals who need data outside of the office.
Embedded BI in Business Applications
Next, embedded BI is another growing trend in which BI capabilities are directly integrated into other business applications. For example, CRM systems might include embedded analytics, allowing users to view relevant data and insights within their workflow. This seamless integration makes data analysis part of the daily routine, providing context-specific insights that enhance productivity and encourage data-driven decisions at the point of action.
Data Storytelling
Data storytelling is becoming a key aspect of self-service BI. Presenting data is not enough; users need to communicate insights effectively. Autonomous BI tools are incorporating features that allow users to create guided narratives around their data, highlighting key findings and explaining their significance. This ensures that insights are shared clearly, making them more compelling and actionable. Data storytelling bridges the gap between analysis and communication, turning complex data into a persuasive message.
The Growing Need for Data Literacy
Finally, increasing data literacy is a parallel trend. As BI tools become more widespread, organizations are investing in training to help employees understand basic data concepts, interpret visualizations, and ask the right questions. Furthermore, this training enhances their ability to use these tools effectively. In turn, improved data literacy maximizes the value of self-service BI investments. Ultimately, it fosters a data-driven culture and equips employees to make informed decisions.

Conclusion
Self-service BI is no longer a niche concept. It is a fundamental shift in how businesses interact with their data. The ability for business users to explore data on their own is transformative. It fosters a culture of curiosity and data-driven thinking. This widespread access to information is a powerful driver of efficiency and innovation.
While self-service BI excels at showing you what has happened and why, gaining deeper, forward-looking insights often requires more advanced analytical power. HDWEBSOFT specializes in developing AI solutions that can be integrated to augment your existing self-service BI environment. We will help build intelligent models that provide insights directly within the tools your business users already use. Contact us today!