The ROI of AI in software development is no longer a theoretical question. It is the question sitting in every engineering leader’s inbox right now. Boards want numbers. CFOs want proof. And yet most teams deploy AI coding tools, watch velocity metrics tick upward, and still cannot explain where the money went or came back from. This blog is the framework that closes that gap.
If you are already familiar with the foundations, our deep-dive on AI-augmented software development covers what the practice actually involves. Here, we go further, past the “what” and into the financial mechanics: what you spend, what you get back, and how to measure it honestly.
Importantly, the data tells a complicated story. Measuring AI developer productivity reveals a paradox: 78% of enterprises now use AI in at least one business function. Yet only 47% of IT leaders report their AI projects are actually profitable. That gap between adoption and payoff is exactly what this post addresses.
Quick Answer: What Is the ROI of AI in Software Development?
The ROI of AI in software development is the net financial return an organization gains from AI coding tools and workflows. It measured against the total cost of implementation, including licensing, integration, training, and technical debt risk.
- Average return is $3.70 per $1 invested across enterprises; top performers reach $10.30
- Most meaningful returns materialise over 2–4 years, not the typical 7–12-month tech payback window
- ROI varies significantly by use case, in which code generation and test automation return the most; architecture assistance remains speculative
- False positives (velocity up, quality down) are the primary reason 70–85% of AI projects fail to show bottom-line impact
- A structured 12-week pilot with a control group is the most reliable path to a defensible business case
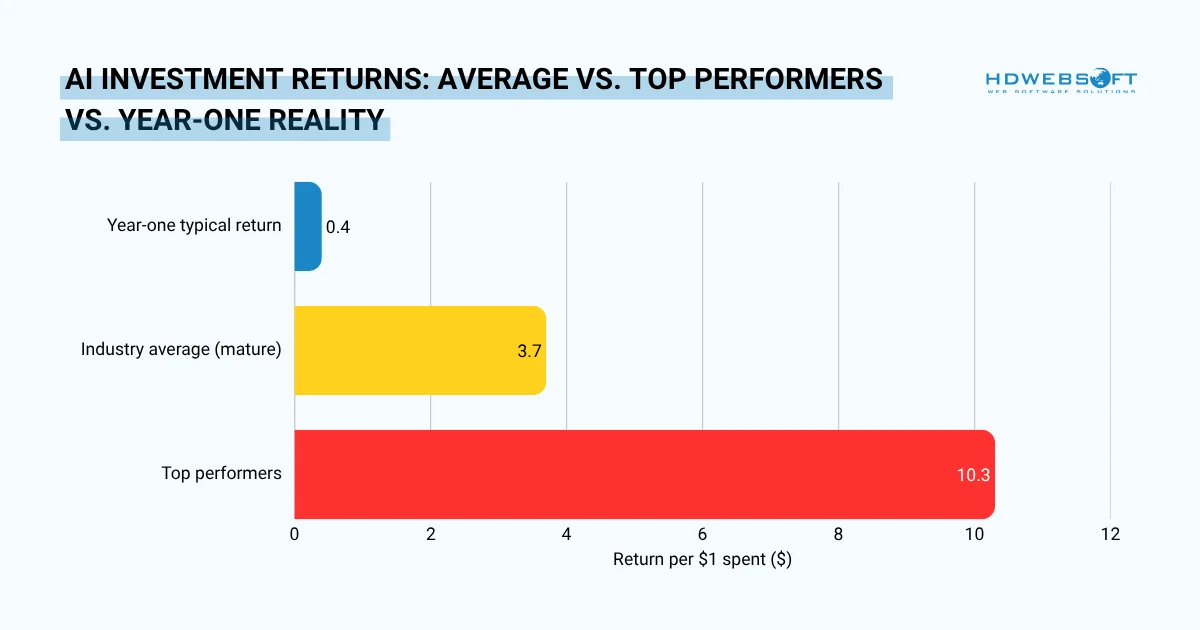
Horizontal bar chart comparing the three ROI scenarios organizations typically encounter when implementing AI in software development. Values represent return per $1 invested.
The Full Cost Model: What You Are Actually Spending
The full cost of AI in software development includes five categories: licensing, integration and security, onboarding, code review overhead, and technical debt risk. For a 30-developer team, the realistic first-year total cost of ownership typically falls between $80,000 and $140,000, not the $9,000 most licensing-only estimates suggest.
Licensing is only the beginning
Most budget conversations start and end with per-seat pricing. That is a mistake. Tool licensing, represents only a fraction of what the organization actually spends. Whether GitHub Copilot at $19–$39 per user per month, or an enterprise Cursor or Codeium tier .
Beyond licensing, four cost categories consistently get underestimated or ignored entirely.
| Cost Category | What It Includes | Typical Magnitude |
|---|---|---|
| Licensing & tooling | Per-seat fees, enterprise tier upgrades, API usage costs | $200–$500/dev/year |
| Integration & security | SSO setup, IP/data governance review, compliance sign-off, audit trails | $15K–$60K one-time |
| Onboarding & training | Workshops, lost productivity during learning curve (4–6 weeks), prompt engineering upskilling | 15–20% of first quarter productivity |
| Code review overhead | Senior engineer time reviewing AI-generated code more rigorously than human-written code | 10–15% of senior eng. hours |
| Technical debt risk | GitClear’s 2024 analysis found AI-assisted coding is linked to 4× more code duplication | Compounding; hard to quantify upfront |
Building Your TCO Number
Add all five rows together across your team size and time horizon. For a 30-developer team running a $25/seat/month tool, the licensing alone totals $9,000 per year.
But once integration, training, and review overhead are included, the realistic first-year ROI of AI in software development often lands between $80,000 and $140,000. That is the number your ROI calculation must justify, not $9,000.
The ROI Framework: From Inputs to Business Outcomes
The correct formula for the AI in software development ROI is: (Value Generated − Total Cost) ÷ Total Cost × 100. Value Generated has three components: hours saved multiplied by loaded developer rate, defects avoided multiplied by average bug resolution cost, and release acceleration multiplied by revenue per sprint.
Each component must be measured independently; bundling them produces numbers that finance teams cannot verify.
The Formula
Calculating the ROI of AI in software development requires the same basic formula used for any capital investment. However, the inputs demand careful sourcing.
ROI Formula for AI Software Development
ROI (%) = [ (Value Generated − Total Cost) ÷ Total Cost ] × 100
Value Generated = (Hours saved × loaded developer rate) + (Defects avoided × avg. bug resolution cost) + (Release acceleration × revenue per sprint)
Total Cost = Licensing + Integration + Training + Review overhead + Technical debt allowance
Translating Hours Saved Into Dollars

For calculating ROI of AI in software development, start with the developer hour. A fully loaded senior engineer in the US typically costs $120–$180 per hour when salary, benefits, and overhead are included.
If AI tools genuinely save that engineer three hours per week then the annual value per developer is approximately $18,000 to $27,000. It’s a conservative estimate supported by Bain research showing 10–15% productivity gains for teams using AI assistants.
However, there is a critical caveat. Bain’s same research notes that teams using AI assistants “often don’t redirect the time saved toward higher-value work.” So even those modest gains frequently don’t translate into positive returns. The formula only works if saved time is deliberately redeployed.
Quantifying Quality Savings
Defect reduction is the most undervalued variable in most ROI models. The cost of a bug caught in code review is a fraction of the cost of one caught in production. If AI-assisted testing catches 20% more defects before release, a realistic outcome with proper implementation, your team can significantly reduce costly production issues.
For example, if you typically resolve 50 production bugs per quarter at an average cost of $2,500 each, that reduction alone can save $25,000 annually. That number belongs in your ROI of AI in software development calculation.
Short-Term vs. Compounding Returns
Year one almost always looks worse than subsequent years as integration costs are front-loaded and the learning curve is real. Consequently, organizations that measure only at the 6-month mark frequently conclude the investment failed. When in reality, the payoff curve is just delayed.
Companies that moved early into AI adoption report $3.70 in value for every dollar invested, with top performers achieving $10.30 returns per dollar. However, those returns typically materialize over 2–4 years, far longer than the 7–12-month payback periods typical of other technology investments.
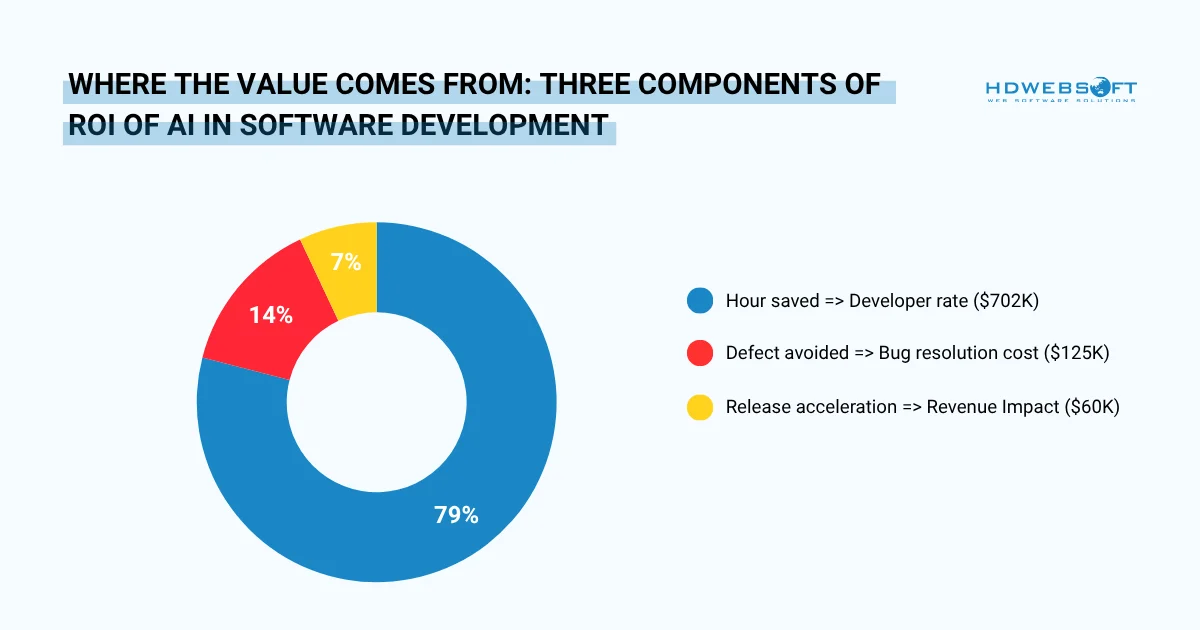
Proportional breakdown of value generated across the three ROI formula components for a representative 30-developer team over 12 months. Based on conservative estimates: 3 hrs/week saved per dev at $150/hr loaded rate; 20% more defects caught pre-release at $2,500 avg resolution cost; 1 additional release per quarter at $15K revenue impact.
ROI by Use Case: Where AI Tools Actually Pay Off
The highest AI software development cost savings come from three use cases: code generation and autocomplete, test writing and QA automation, and code review assistance. These deliver measurable returns within the first two quarters.
Breaking Down ROI by Development Activity
The table below maps common use cases to their realistic ROI of AI in software development tier, the mechanism of value creation, and the key risk that can erode that value.
| Use Case | ROI Tier | Value Mechanism | Key Risk |
|---|---|---|---|
| Code generation & autocomplete | High | Reduces boilerplate time; accelerates sprint velocity on well-defined tasks | Code duplication, acceptance without review |
| Test writing & QA automation | High | Senior engineers spend 20–30% of time on test coverage; AI reclaims much of that | Tests that pass but don’t cover edge cases |
| Code review assistance | High | Reduces senior engineer bottleneck on PR queues; flags security issues earlier | Over-reliance; junior devs skip learning from reviews |
| Documentation generation | Medium | Eliminates a task developers routinely defer; reduces onboarding time for new hires | Generic or inaccurate docs that mislead future devs |
| Legacy code comprehension | Medium | Dramatically reduces time spent deciphering undocumented legacy systems | Model hallucinations on obscure codebases |
| Architecture & system design | Speculative | Useful as a sounding board; high-level suggestions can save early design hours | Confidently wrong advice on complex domain-specific systems |
Notably, code generation leads market adoption for good reason: the code generation and autocomplete segment held 31.9% of revenue in 2024. The market is following the ROI of AI in software development signals.
The KPI Dashboard: What to Track and What to Ignore
The most reliable KPIs for measuring AI developer productivity are cycle time, defect escape rate, release frequency, and mean time to recovery. They are all lagging indicators tied to business outcomes. These must be paired with leading indicators such as code acceptance rate, PR review time, and rework rate.
IBM’s 2024 research confirms that faster software development (25%), rapid innovation (23%), and productivity time savings (22%) are the top three metrics decision-makers actually use to calculate AI ROI.
A Two-Tier Measurement System
Effective measuring AI developer productivity requires distinguishing between metrics that reflect business outcomes (lagging) and those that signal whether outcomes are likely (leading). Both tiers are necessary. Neither is sufficient alone.
| Tier 1 – Lagging Indicators (Business Outcomes) | Tier 2 – Leading Indicators (Process Signals) |
|---|---|
| Cycle time: days from commit to production deployment | Code acceptance rate: % of AI suggestions kept after review |
| Defect escape rate: bugs reaching production per sprint | PR review time: average hours per pull request |
| Release frequency: deployments per month | Test coverage delta: % change in automated test coverage |
| Mean time to recovery (MTTR): hours to resolve production incidents | Rework rate: % of code modified within 2 weeks of merge |
| Engineer-to-feature ratio: features shipped per developer per quarter | AI-assisted task ratio: % of commits with AI tool involvement |
Metrics to Actively Avoid
Some measurements feel productive but actively mislead. Tracking these can cause teams to optimize for the wrong outcomes.
Vanity Metrics: Do Not Use for ROI of AI in Software Development Decisions
- Lines of code generated by AI (volume ≠ value)
- Total AI suggestions offered (irrelevant without acceptance context)
- Developer satisfaction scores alone (positive sentiment can mask debt accumulation)
- Raw suggestion acceptance rate without quality audit (30% acceptance of poor code is worse than 10% acceptance of excellent code)
Critical Prerequisite
Establish a pre-AI baseline for every Tier 1 metric before deployment. Without a baseline, you cannot prove causality. You can only describe correlation and finance teams will not fund the next phase based on correlation alone.
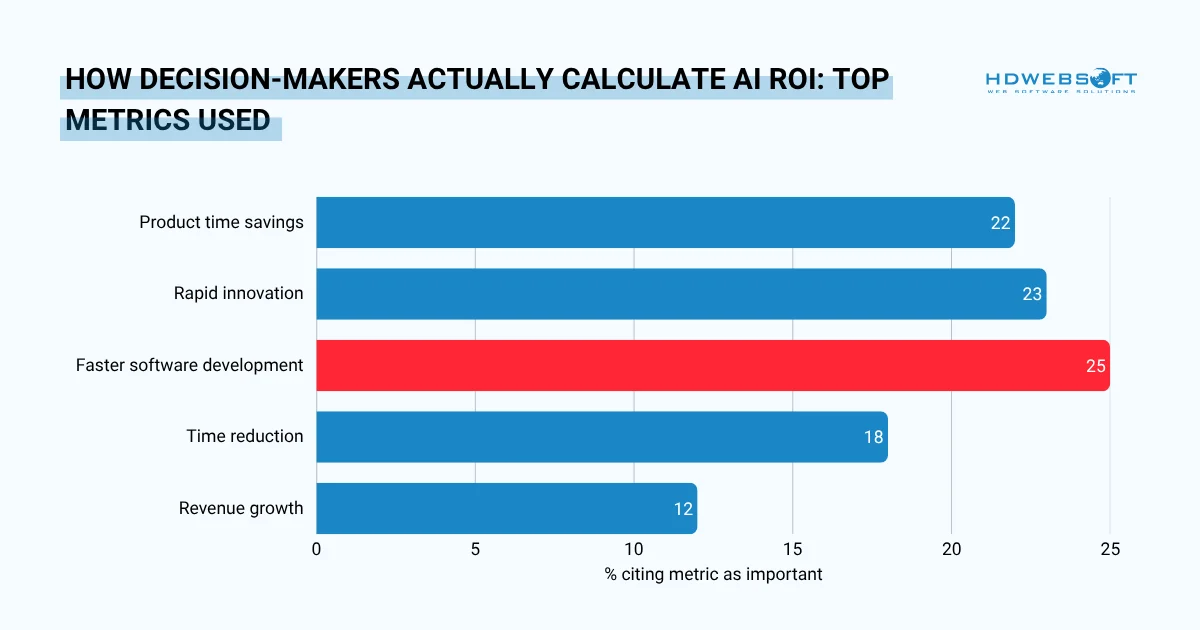
Horizontal bar chart showing the percentage of IT decision-makers who cite each metric as important for calculating ROI from AI investments.
Common False Positives: When the Numbers Lie
The three most common false positives in ROI of AI in software development are: the “velocity up, quality down” pattern (sprint speed rises while defect density quietly grows), the acceptance rate illusion (high suggestion acceptance without quality auditing), and attribution error (productivity gains credited to AI when organizational changes were the real cause).
The “Velocity Up, Quality Down” Pattern
This is the most common false positive in AI-augmented development. Sprint velocity increases. Story points close faster. Leadership celebrates. Meanwhile, defect density quietly climbs, and technical debt accumulates at a rate the team cannot yet see.
GitClear’s analysis of over 153 million lines of code found that AI-assisted coding correlates with 4× more code duplication and a historic reversal in copy-paste vs. refactoring behavior. Faster output, but structurally weaker output. The velocity metric tells one story. The codebase tells another.
How to Detect It
Track the rework rate metric described in the KPI section above. If more than 20% of merged code is significantly modified within two weeks, velocity is probably being borrowed from future sprints, not genuinely generated.
The Acceptance Rate Illusion
A 46% code completion rate sounds impressive. GitHub Copilot achieves roughly that figure in Q1 2025 usage data. However, only around 30% of suggestions are actually accepted by developers.
More importantly, acceptance is not the same as correctness. Accepted code that introduces a subtle security vulnerability or architectural inconsistency has negative ROI of AI in software development, regardless of what the acceptance dashboard shows.
The Attribution Error
Did the productivity gain come from the AI tool or from the team reorganization that happened to coincide with deployment? From the new sprint rhythm the Scrum master introduced? From the fact that the two slowest developers left the company that quarter?
Without a control group, attribution is guesswork. And guesswork does not survive a board-level ROI review. Design your pilot (covered in the next section) specifically to isolate the AI variable from surrounding organizational changes.
Reality Check
Developers expect 24% productivity gains from AI tools. Controlled studies, however, show some experienced developers actually perform 19% slower on complex tasks when forced to use AI assistance. Perception and measurement are not the same thing.
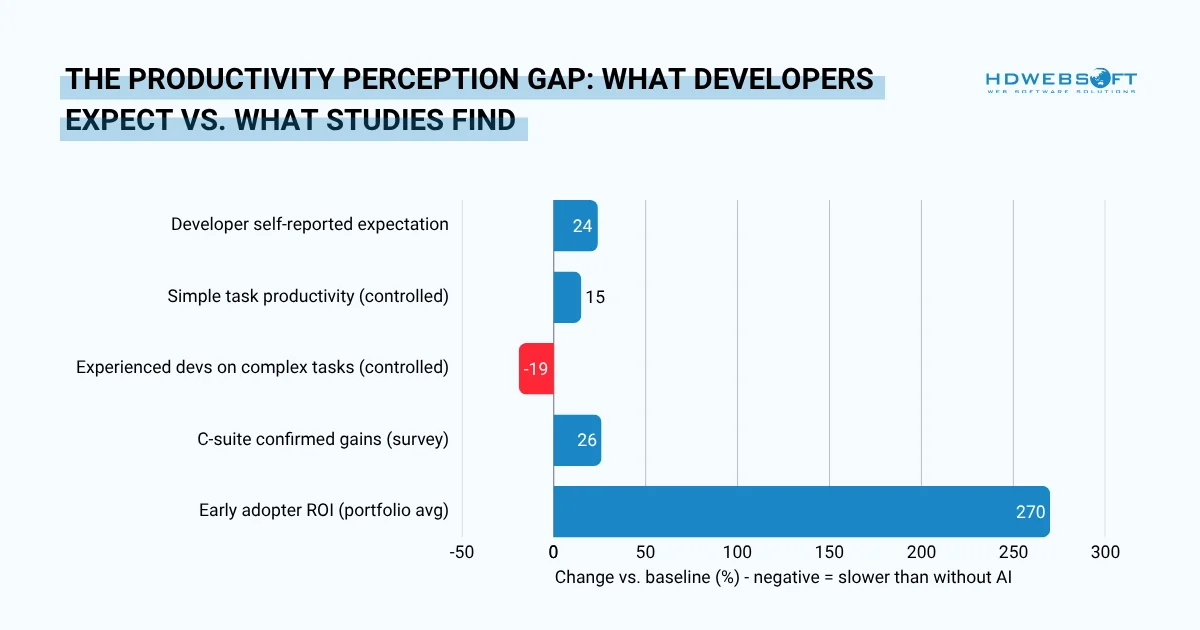
Diverging bar chart contrasting self-reported productivity expectations against controlled-study findings. Positive values indicate productivity gains; negative values indicate slowdowns. The gap between perception and measured reality is the primary driver of false-positive ROI reporting.
The Pilot Program Structure: Proving Value Before Full Rollout
A reliable AI development pilot runs across three phases over 12 weeks. This structure generates the evidence needed to make the case of ROI of AI in software development case defensible, not just plausible.
A Three-Phase Pilot Design
Structure the pilot around a falsifiable hypothesis. For example: “AI coding tools will reduce average cycle time by 15% for the payments team within 10 weeks, with no increase in defect escape rate.” Everything else follows from that statement.
Weeks 1–4: Baseline and Hypothesis
Select a pilot group (8–15 developers) and a matched control group doing similar work without AI tools. Measure all Tier 1 KPIs for both groups before any AI deployment.
Moreover, define your go/no-go criteria explicitly: what number would prove success, and what would prove failure? Document it before you start.
Weeks 5–10: Instrumented Rollout
Deploy AI tools to the pilot group only. Track all Tier 1 and Tier 2 KPIs weekly for both groups. Hold weekly retrospectives in the pilot group specifically to surface false positives. Notably, ask developers where the tool is hurting quality, not just where it is helping speed.
Weeks 11–12: Readout and Decision
Compare pilot group KPIs against control group and against baseline. Calculate the ROI of AI in software development formulas with real numbers. Don’t forget to apply the go/no-go criteria you defined in Phase 1.
More importantly, a readout that confirms the hypothesis is the business case is much needed. It’s a readout that refutes it is equally valuable as it tells you which use cases to focus on before scaling.
Go / No-Go Criteria Checklist
| Criterion | Go Signal | No-Go Signal |
|---|---|---|
| Cycle time | ≥10% reduction vs. control | No change or increase |
| Defect escape rate | Flat or reduced | Increased vs. baseline |
| Rework rate | Below 20% | Above 25% |
| Developer adoption | ≥70% active daily use by week 8 | Below 40% adoption by week 8 |
| Projected 12-month ROI | Positive after full cost model | Negative or requires heroic assumptions |
Building the Internal Business Case
An effective ROI of AI in software development memo for a CFO or board contains six elements in this order. Respectively, they are a quantified problem statement, the proposed solution, a full TCO table, pilot evidence vs. control group, a projected return in three scenarios (conservative, base, optimistic), and the specific ask.
The One-Page ROI Memo Structure
Finance and executive audiences read ROI memos differently from engineers. They scan for the problem, the cost, the evidence, and the ask in that order. Front-load the conclusion and save the methodology for the appendix.
| Section | What It Contains | Length |
|---|---|---|
| Problem statement | What business outcome is currently constrained by development speed or quality? Quantify it in revenue or cost terms. | 2–3 sentences |
| Proposed solution | AI-augmented development tooling, deployed to X developers across Y teams. | 1–2 sentences |
| Full cost | 12-month TCO using the five-category cost model from Section 1. | One table |
| Pilot evidence | Pilot KPI results vs. control group. Observed ROI from the pilot, annualised. | 3–5 data points |
| Projected return | Apply the formula for ROI of AI in software development to full team size. Show conservative, base, and optimistic scenarios. | One table or chart |
| The ask | Budget, headcount, or approval required. Timeline for next decision point. | 1 paragraph |
Handling the Three Common Objections
Three objections appear in almost every AI investment conversation. Anticipate them rather than waiting to be asked.

Objection 1: “What about IP and data security?”
Enterprise tiers of tools like GitHub Copilot and Cursor explicitly offer data isolation. The code is not used for model training, and queries do not leave the organization’s tenant. Hence, reference this directly and include the security review findings from your pilot’s integration phase.
Objection 2: “What if the model vendor disappears or raises prices?”
Acknowledge the dependency risk honestly. Then explain the mitigation: team workflows should be designed around AI-assistance as a capability, not around any single vendor’s product. The process improvements survive a vendor change even if the specific tool does not.
Objection 3: “Our developers are already fast. Why do we need this?”
Speed is not the only value lever. Redirect to quality and capacity: if the same team can ship features with fewer defects and handle 20% more work without additional headcount, the ROI case holds regardless of whether current velocity feels satisfactory.
The Bottom Line
The ROI of AI in software development is real but it’s not automatic. The average $3.70 return per dollar invested exists at the portfolio level. Your team’s actual return depends entirely on what you measure, what you deploy, and whether your pilot was honest enough to tell you where the value is not coming from.
Start with the full cost model. Build the pilot around a falsifiable hypothesis. Track lagging and leading indicators simultaneously. And resist the false positives and velocity metrics that tell a better story than the codebase deserves.
Done correctly, AI-augmented software development ROI becomes a repeatable, defensible number. That is the kind of business case that gets approved and funded again in year two.
ROI of AI in Software Development FAQs
What is a realistic ROI of AI coding tools in enterprise software development?
A realistic ROI for AI coding tools in enterprise software development is $3.70 per dollar invested on average, according to 2025 data. Top-performing organizations achieve up to $10.30 per dollar. However, most meaningful returns take 2–4 years to materialize. It’s significantly longer than the 7–12 month payback period typical of other technology investments.
Moreover, year-one ROI of AI in software development is almost always negative or marginal due to front-loaded integration, security, and training costs.
How do you measure AI developer productivity accurately?
Accurate measurement of AI developer productivity requires two tiers of metrics.
- Lagging indicators to track business outcomes: cycle time, defect escape rate, release frequency, and MTTR.
- Leading indicators signal whether outcomes are likely: code acceptance rate, PR review time, rework rate, and test coverage delta.
A pre-AI baseline for every metric is non-negotiable. Without it, you cannot separate the AI tool’s effect from simultaneous organizational changes.
Avoid vanity metrics such as lines of code generated or total suggestions offered. These measure AI activity, not AI value.
What is the total cost of implementing AI tools for software development teams?
The total cost of implementing AI tools for a 30-developer team typically ranges from $80,000 to $140,000 in year one. This includes:
- Licensing ($200–$500 per developer per year)
- Integration and security review ($15,000–$60,000 one-time)
- Onboarding and training (15–20% of first-quarter productivity)
- Code review overhead (10–15% of senior engineer hours)
- Technical debt allowance.
On the other hand, licensing alone accounts for less than 15% of the true total. It’s often the only cost included in initial estimates.
Why do most AI software development projects fail to show ROI?
Between 70% and 85% of AI projects fail to show meaningful bottom-line impact for four main reasons. First, teams measure velocity rather than value because sprint speed increases but the time saved is not redirected to higher-value work. Second, code acceptance rates are tracked without quality audits, creating an acceptance rate illusion.
Third, organizations lack a control group, making it impossible to attribute gains to the AI tool specifically. Fourth, IBM’s research found that only 15% of US employees report their workplace has communicated a clear AI strategy. Without a plan, gains are accidental rather than repeatable.
Which AI use case in software development has the highest ROI?
The three AI use cases with the highest ROI of AI in software development are: code generation and autocomplete (reduces boilerplate time; dominates with 31.9% of AI-in-dev market revenue in 2024), test writing and QA automation (reclaims 20–30% of senior engineer time spent on test coverage), and code review assistance (reduces PR bottlenecks and surfaces security issues earlier). Documentation generation and legacy code comprehension offer medium-tier returns. Architecture and system design assistance remains speculative and should not anchor a business case.
How long should an AI development pilot program run before measuring ROI?
An AI development pilot program should run for 12 weeks minimum before measuring ROI of AI in software development. The first four weeks establish baselines and define the hypothesis. Weeks five through ten run the instrumented deployment with a matched control group. Weeks eleven and twelve produce the readout. A shorter pilot cannot distinguish the tool’s effect from the learning curve.
Notably, pilots shorter than eight weeks almost always show inconclusive or misleading results because developers are still adjusting their workflows, review habits, and prompt discipline.