Our client is a leading business intelligence (BI) tool provider in the United States. Their BI tools are used by some of the largest businesses in the world. As they have grown, they have seen a demand for a generic platform that their specific production lines can use.
The Data Analysis Tool Platform will need to be able to collect data from a variety of sources, including sensors, machines, and databases. It will also need to be able to analyze the data and provide insights that can help the client improve their production processes.
We are excited to be working with this client to build this platform. We believe it has the potential to revolutionize how they operate their businesses.
Learn more about our Platform Development.
Features
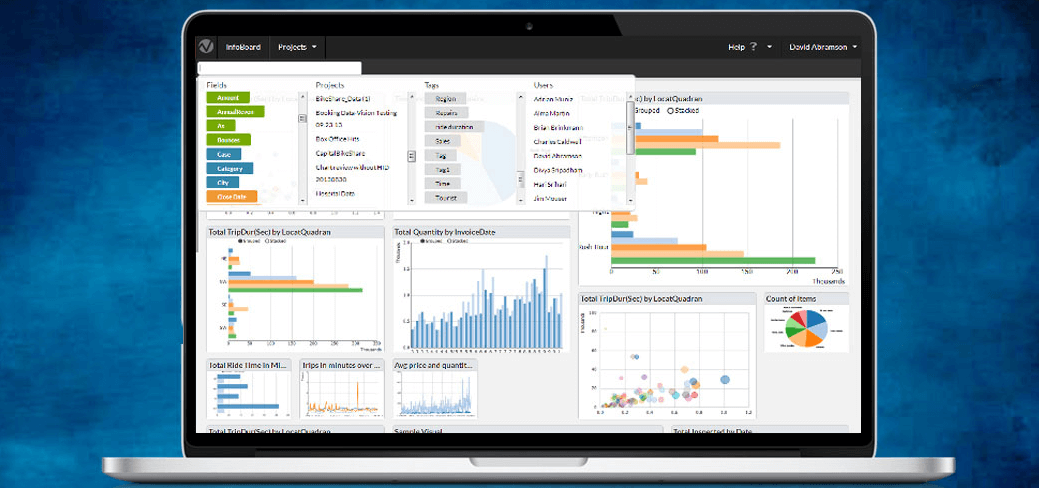
- Data Hub: A bridge that allows users to query different databases using the same query form. This means that users can easily access data from various data sources without having to worry about the specific data format.
- Visualization Builder: A tool that allows users to build different visualizations from a data source. This includes charts, graphs, and maps. Users can choose from a variety of pre-built visualizations, or they can create their custom visualizations.
- Visualization Management: A tool that allows users to manage visualizations. This includes the ability to view, edit, and delete visualizations. Users can also create folders to organize their visualizations.
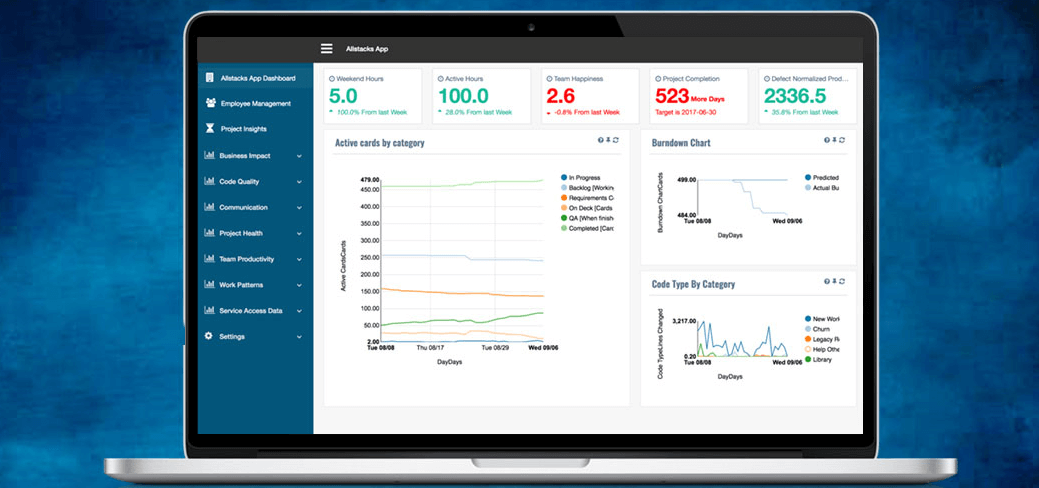
- Dashboard Builder: A tool that allows users to build a dashboard from the managed visualizations. This means users can create a single page displaying all their important visualizations. Dashboards can be customized to fit the specific needs of the user.
Technology
The platform demonstrates our ability to combine different technologies to build a complex platform. Here are the specific technologies that we used:
- .NET development for the backend: We used .NET to build the backend of the platform. .NET is a powerful and versatile framework that allows us to build high-performance, scalable applications. Learn more about our .NET Development Services.
- Angular v1 development and jQuery for the front end: We used Angular 1 and jQuery to build the platform’s front end. Angular 1 is a robust JavaScript framework that allows us to build dynamic and interactive web applications. jQuery is a popular JavaScript library that allows us to manipulate the DOM and add functionality to web pages. Learn more about our Angular Development.
- JavaScript-based visualization libraries such as HighCharts and D3 for the charts: We used JavaScript-based visualization libraries such as HighCharts and D3 to create the charts in the platform. These libraries allow us to create beautiful and interactive charts that can be used to visualize data. Learn more about our Data Visualization Development and Front-end Development.
- Data science theories such as data binding and data sampling for pre-processing: We used data science theories such as data binding and data sampling to pre-process the data before it was used in the platform. This helped us to ensure that the data was clean and accurate. Learn more about our Data Processing and Development.
- A test-driven development (TDD) approach: We used a test-driven development (TDD) approach. TDD is a software development process that helps ensure the code’s quality. We used TDD to write unit tests for the code, which helped us to find and fix bugs early in the development process. Learn more about our Software Testing Services.
The platform demonstrates our ability to build complex, high-quality platforms using various technologies. We are confident we can use our skills and experience to build similar platforms for other clients.
Challenges
- Immature technologies: The platform was built on immature technologies, namely Angular 1 and jQuery. These technologies were at the early stage of the UI framework revolution, and newer versions have since superseded them. This means that the platform is based on technology that is not fully functional or reliable.
- Different database queries and syntax: Each database has unique queries and syntax. This can make creating a platform that can query all the different databases challenging. It is also challenging to ensure the platform is compatible with all the different database versions.
Solutions
- A trade-off between complex UI and the capacity of jQuery and Angular 1: We carefully considered the trade-off between the complexity of the user interface and the capacity of jQuery and Angular 1. We chose to implement a more straightforward user interface that was more compatible with the capabilities of the libraries.
- Good code structure for Angular 1: We created a code structure for Angular 1. This made the code easier to maintain and update, and it also made it easier to find and fix bugs.
- Balanced solutions for database queries: We analyzed the different database queries and made balanced solution decisions in terms of features, performance, and maintenance. We chose solutions that would meet the users’ needs while being efficient and easy to maintain.
Business outcomes
- We resolved many hard technical issues, such as compatibility issues with different database query syntaxes. This allowed us to create a platform that was more reliable and easier to use.
- Used in client’s BI productions: The platform has been used in the client’s BI productions. This means the platform has been used to collect data from various sources, analyze them, and provide insights to help the client improve their production processes.