

Our data visualization development services
Thoroughly more than 14 years of experience, HDWEBSOFT has been proudly offering data visualization development services to make great software abilities to show companies spot trends, track business goal achievements, compare the performance with different categories, products, brands, and so on.

Data Visualization Platform Development Services

Data Visualization SDK Development Services

Data Visualization Dashboard Development Services

D3 Development Services

HighCharts Development Services

Custom Chart Development Services
Technologies
Experience
12
We utilize D3, a JavaScript library, to create stunning SVG visualizations driven by data, enabling rich and interactive visual experiences.
Experience
13
It's widely used for log and full-text search, real-time analytics, and application monitoring.
Case Studies
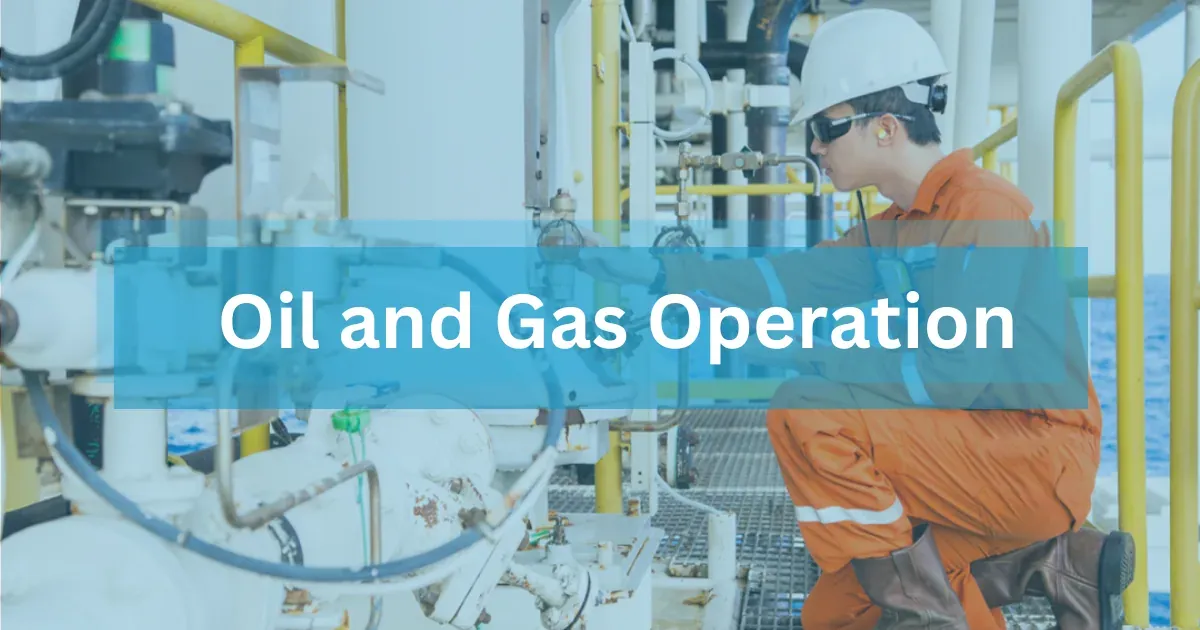
An oil and gas pressure monitoring system
This pressure monitoring system lets you see your entire oil and gas operation more clearly, respond to issues more quickly, and connects you to a world of savings in all working environments.
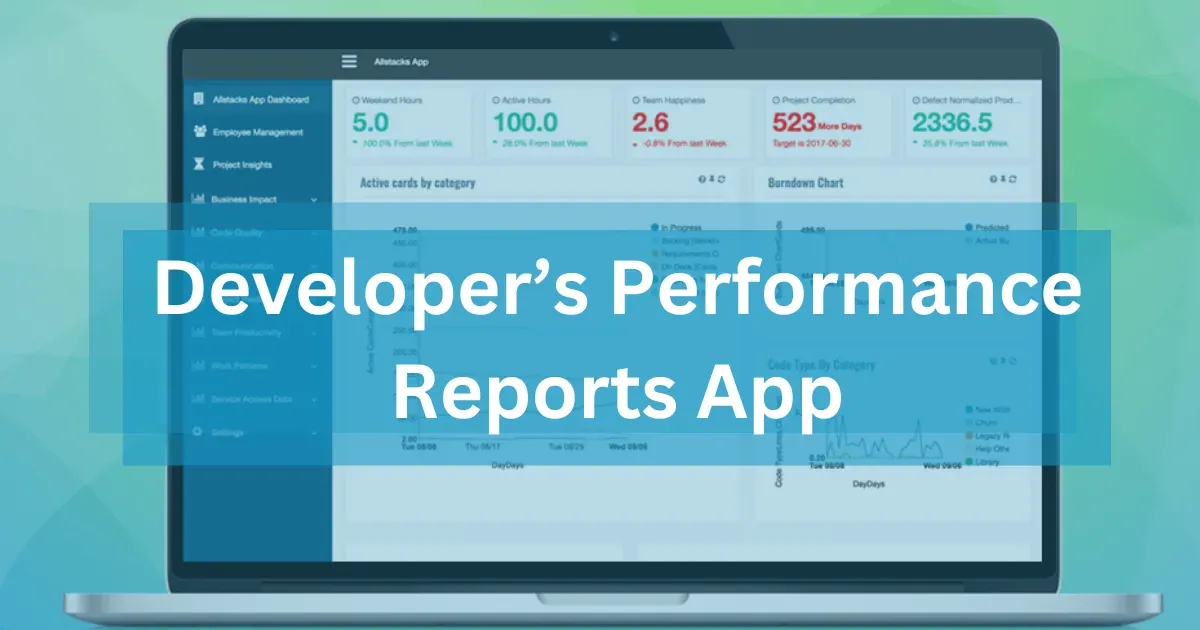
A developer tracking and reporting application
This application helps you to generate performance reports of your developers by collecting data from GIT or development tracking systems and put them in one place.
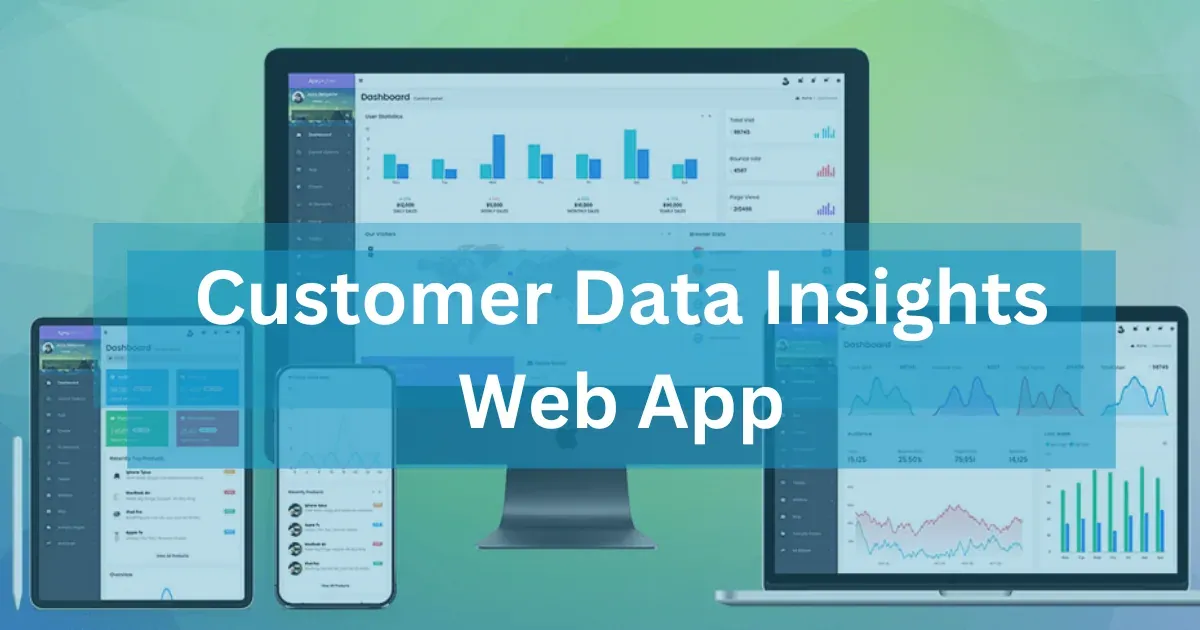
Shopko Customer Data Insights: Project with Advanced Tech
Shopko Customer Data Insights is a tool that helps clients refine and report consumer data. It collects, manages, and analyzes customer data to gain insights into customer behavior and preferences. These insights are then used to improve customer experiences and drive business growth.